High yield personal loan paper investments attract investors attention who are hungry for yield return. But to earn these attractive yield return, investors would have to make risky investment decisions. Read on to find out how to mitigate making risky investment decisions using algorithmic data model.
Checking credit score and history, can not predict future loan payment default
Investors lose money when the loan paper that they invested in, defaulted by borrowers. Focusing on borrower credit score and credit history, will not be enough to avoid bad loan paper. But what if we could reliably predict the likelihood of a bad loan paper default based on some factors of a loan paper?
Using loan paper datasets from Lending Tree, I set out to identify which dataset features should investors focus on, if they want to avoid losing money in bad loan paper. I first used feature importance from GradientBoosting classifier to identify the features that have the most correlation to loan paper default. Then I use partial dependent plot to examine how each unit increase of the dataset features influence the overall prediction. Finally Shapley plot is used to see what is going on behind the thinking of the algorithmic data model.
To learn how I derived the result of these data model, please checkout my full working code in this link below. Full working codes here
Prediction credibility by GradientBoosting classifier
Using LendingTree datasets, after loading, data cleaning and fitting, GradientBoosting classifier produced an accuracy score prediction of 75%. This means if investors making investment decisions strictly based on recommendation predictions made by this GradientBoosting classifier, the investors would have been profitable 75% of the time, while suffered loss 25% of the time.
GradientBoosting ROC AUC: 0.7508760735135249
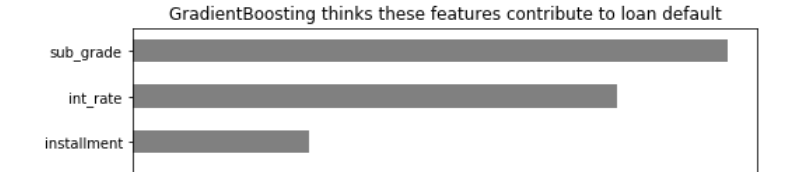
High sub grade loan and interest rate contributed most to borrowers defaulting on loan paper payment.
Lending Tree has collected a long list of loan paper dataset features supposedly to give investors an edge in investing. But the overwhelming data can be confusing and misleading. With proper method and correct algorithmic data model, these confusing dataset features can be turned into useful guide to investing.
Feature Importance of GradientBoosting classifier found high sub grade loan followed by high interest rate to have most influence on triggering loan default.
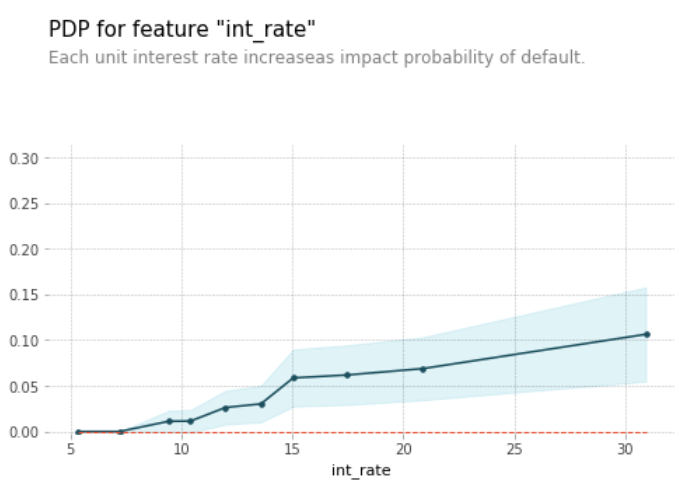
Partial dependence plot showed how each unit increase of interest rate impacted on the probability of loan paper default.
How much interest rate increased would have material impacts on borrower ability to make future payment? Partial dependence plot showed interest rate below 15% has lower probability of default. A rise of interest rate beyond 20%, raises loan default probabilities.
Shapley showed how fairly distribute the “payout” among the features
Since GradientBoosting classifier data model predictions range from 70-80% accuracy, this means 20-30% predictions made, are wrong. To look into what GradientBoosting classifier was thinking when it made right prediction versus wrong prediction, Shapley plot was plotted to show which dataset features skewed the probability reading to cause GradientBoosting classifier to make a right or wrong prediction.
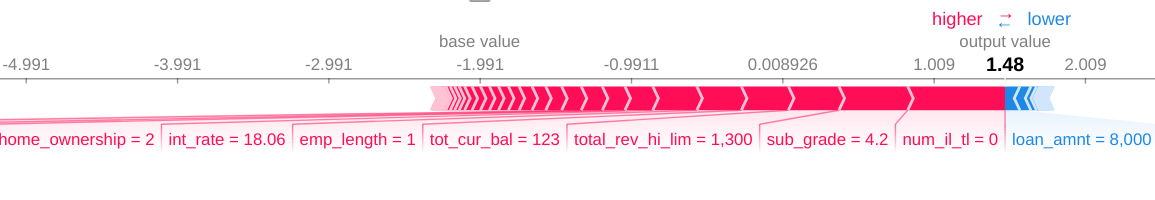
Example case where GradientBoosting correctly (70-80%) predicted loan default (gb_pred=1) and the true value (y_val) of the case confirmed the loan was indeed defaulted.
To examine cases where prediction was correctly predicted, first find cases that was correctly predicted.
# True positives, with high confidence
preds[(y_val==1) & (gb_pred==1)].sort_values(by='confidence', ascending=False).head(3)

	y_val	gb_pred	gb_pred_proba	confidence
17575	1	1	0.844540	0.344540
24768	1	1	0.814926	0.314926
36032	1	1	0.800420	0.300420
Shapley plot showed having zero “number of installment accounts” versus “$8000 loan amount” as having high impact on probability of loan default.
For example case 24768, GradientBoosting has correctly predicted loan to default. Shapley plot showed having high “number of installment accounts” versus $8000 loan amount” as high impact for case loan paper 24768 to default. Next “total revolving high limit”, high “sub grade” loan paper and high “interest rate” also to be high risk for default.
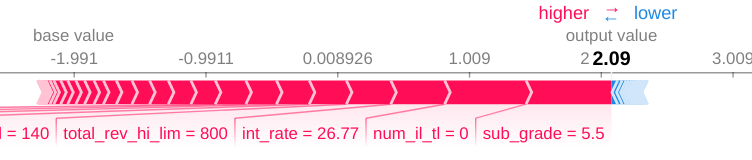
Example case where GradientBoosting wrongly (20-30%) predicted loan default, but did not.
Example case where GradientBoosting predicted loan default, but the loan did not default.
# False positives, with high (mistaken) confidence
preds[(y_val==0) & (gb_pred==1)].sort_values(by='confidence', ascending=False).head(3)

	y_val	gb_pred	gb_pred_proba	confidence
33542	0	1	0.890068	0.390068
11486	0	1	0.688957	0.188957
34640	0	1	0.687962	0.187962
Did GradientBoosting do something wrong that produced a wrong prediction?
For example case 33542, Shapley plot showed having high “sub grade=5.5” and high “interest_rate=26.77” to be high risk for default. But reality is unpredictable and the borrower that belonged to the case 33542 loan paper, did not default and commit to make payment up to the date as the data was collected. This means the possibility of future default beyond the date that data was collected, still exists because the probability of default remains at 70-80%.
Conclusion
As seen above, ensembled tree data model such as GradientBoosting classifier can be very useful tool to guide investors navigating through the confusing and misleading statistical data that were collected for investment. Without tools such as algorithmic data model, investors would have to rely on instinct and experience plus luck to be successful in investing. Ensembled tree GradientBoosting classifier data model not only provides a mathematical formula approach to investing, it also let investors question that the logic that makes up the prediction behind the scene.